Began with a pretty big gap to fill, resulting in substantial support costs involved in building custom reports and churn risk. Due to the recent decision of 'selling direct', we've hit a roadblock in researching and improving our reports, as our reselling partners are keeping customers and most of the customized reports away from MYOB. But in the end, we turned struggled users into feeling fully in control.
Task
Product leadership role, business case and strategy pitch
Stages
Business case Strategy Mockups Research IA Usability guide
Methods
Cost/benefit Data driven Workshops Validation
Tools
Figma Excel Airtable Dovetail
TL;DR
75% of the requests were related to reports not meeting expectations and being difficult to use, which has been causing high support costs and churn risks. Adding to the complexity, MYOB's decision to sell direct has led to reselling partners withholding customers and stopping sharing custom-built reports with us.
I conducted a comprehensive gap analysis, comparing high-usage reports from desktop products and facilitate regular Excel workshops and competitor reviews with the PM, BAs, and Consultants. I delved deep into arithmetic and formatting and raised UX issues such as illogical grouping, visual hierarchy, and confusing calculations. To ensure success, I fostered relationships with high CSAT large reselling partners, seeking their technical reviews and best practice advice. I also conducted 23 extensive qualitative research sessions, including EAPs and non-customers. Finally, I standardised view controls for all reports and passed the feasibility check.
Our initial release of 4 report redesigns to EAPs further boosted our confidence in this improvement. We eliminated redundant reports, lowered the learning curve by hiding complexities, and made a shift towards self-service baseline reporting possible (estimated 95% of use cases covered based on EAP approvals), leading to fewer support time sinks.
PROBLEM
Insufficient report personalization result in 75% of report requests and lead to churn. Making the shift towards self-service is essential to tackle this issue and enhance the user experience.
75% of report requests and churns stem from insufficient report personalization, as shown by data from Tableau and Workfront. We were in the EAP phase of the online payroll app (Advanced Payroll), but based on the growth trajectory towards a convertible desktop user base, we are quite concerned about continuing high-touch service. Our aim is to transition to a fully self-service approach. This research holds value in achieving that goal.
Time sink
Our users typically reach out to consultants to tailor our reports to their needs. With our 16 NZ clients, we've been pretty swamped handling these changes. However, if we ramp up to 300 NZ clients, that's almost 20 times our current workload! And for our AU clients, it'd be even more intense. If we can zero in on making self-serve feasible and user-friendly, we might be able to save up to 1,000 hours.
Churn risk
The online payroll platform's complexity is a step down in user experience. This app has an ERP background and can handle queries and scripts, but it makes it harder for average payroll users to switch over. Reselling partners used to dig in the technical side and create easy-to-use reports. However, selling directly means we need to develop our own reports that match industry standards and quality.
STRATEGY
Our strategic goal: enable confident migration of desktop customers to online payroll through better self-service reporting. We took a weighted, multi-pronged approach to guide decisions transparently: 40% – Partner technical reviews: leveraged top CSAT partners and acquired resellers for expert insights 30% – Internal analysis: support tickets, usage data, competitor reviews 30% – Market validation: qualitative interviews with non-customers via Askable
By assigning weights of 40%, 30%, and 30% to each factor, we ensure transparency in the decision-making process among all stakeholders.
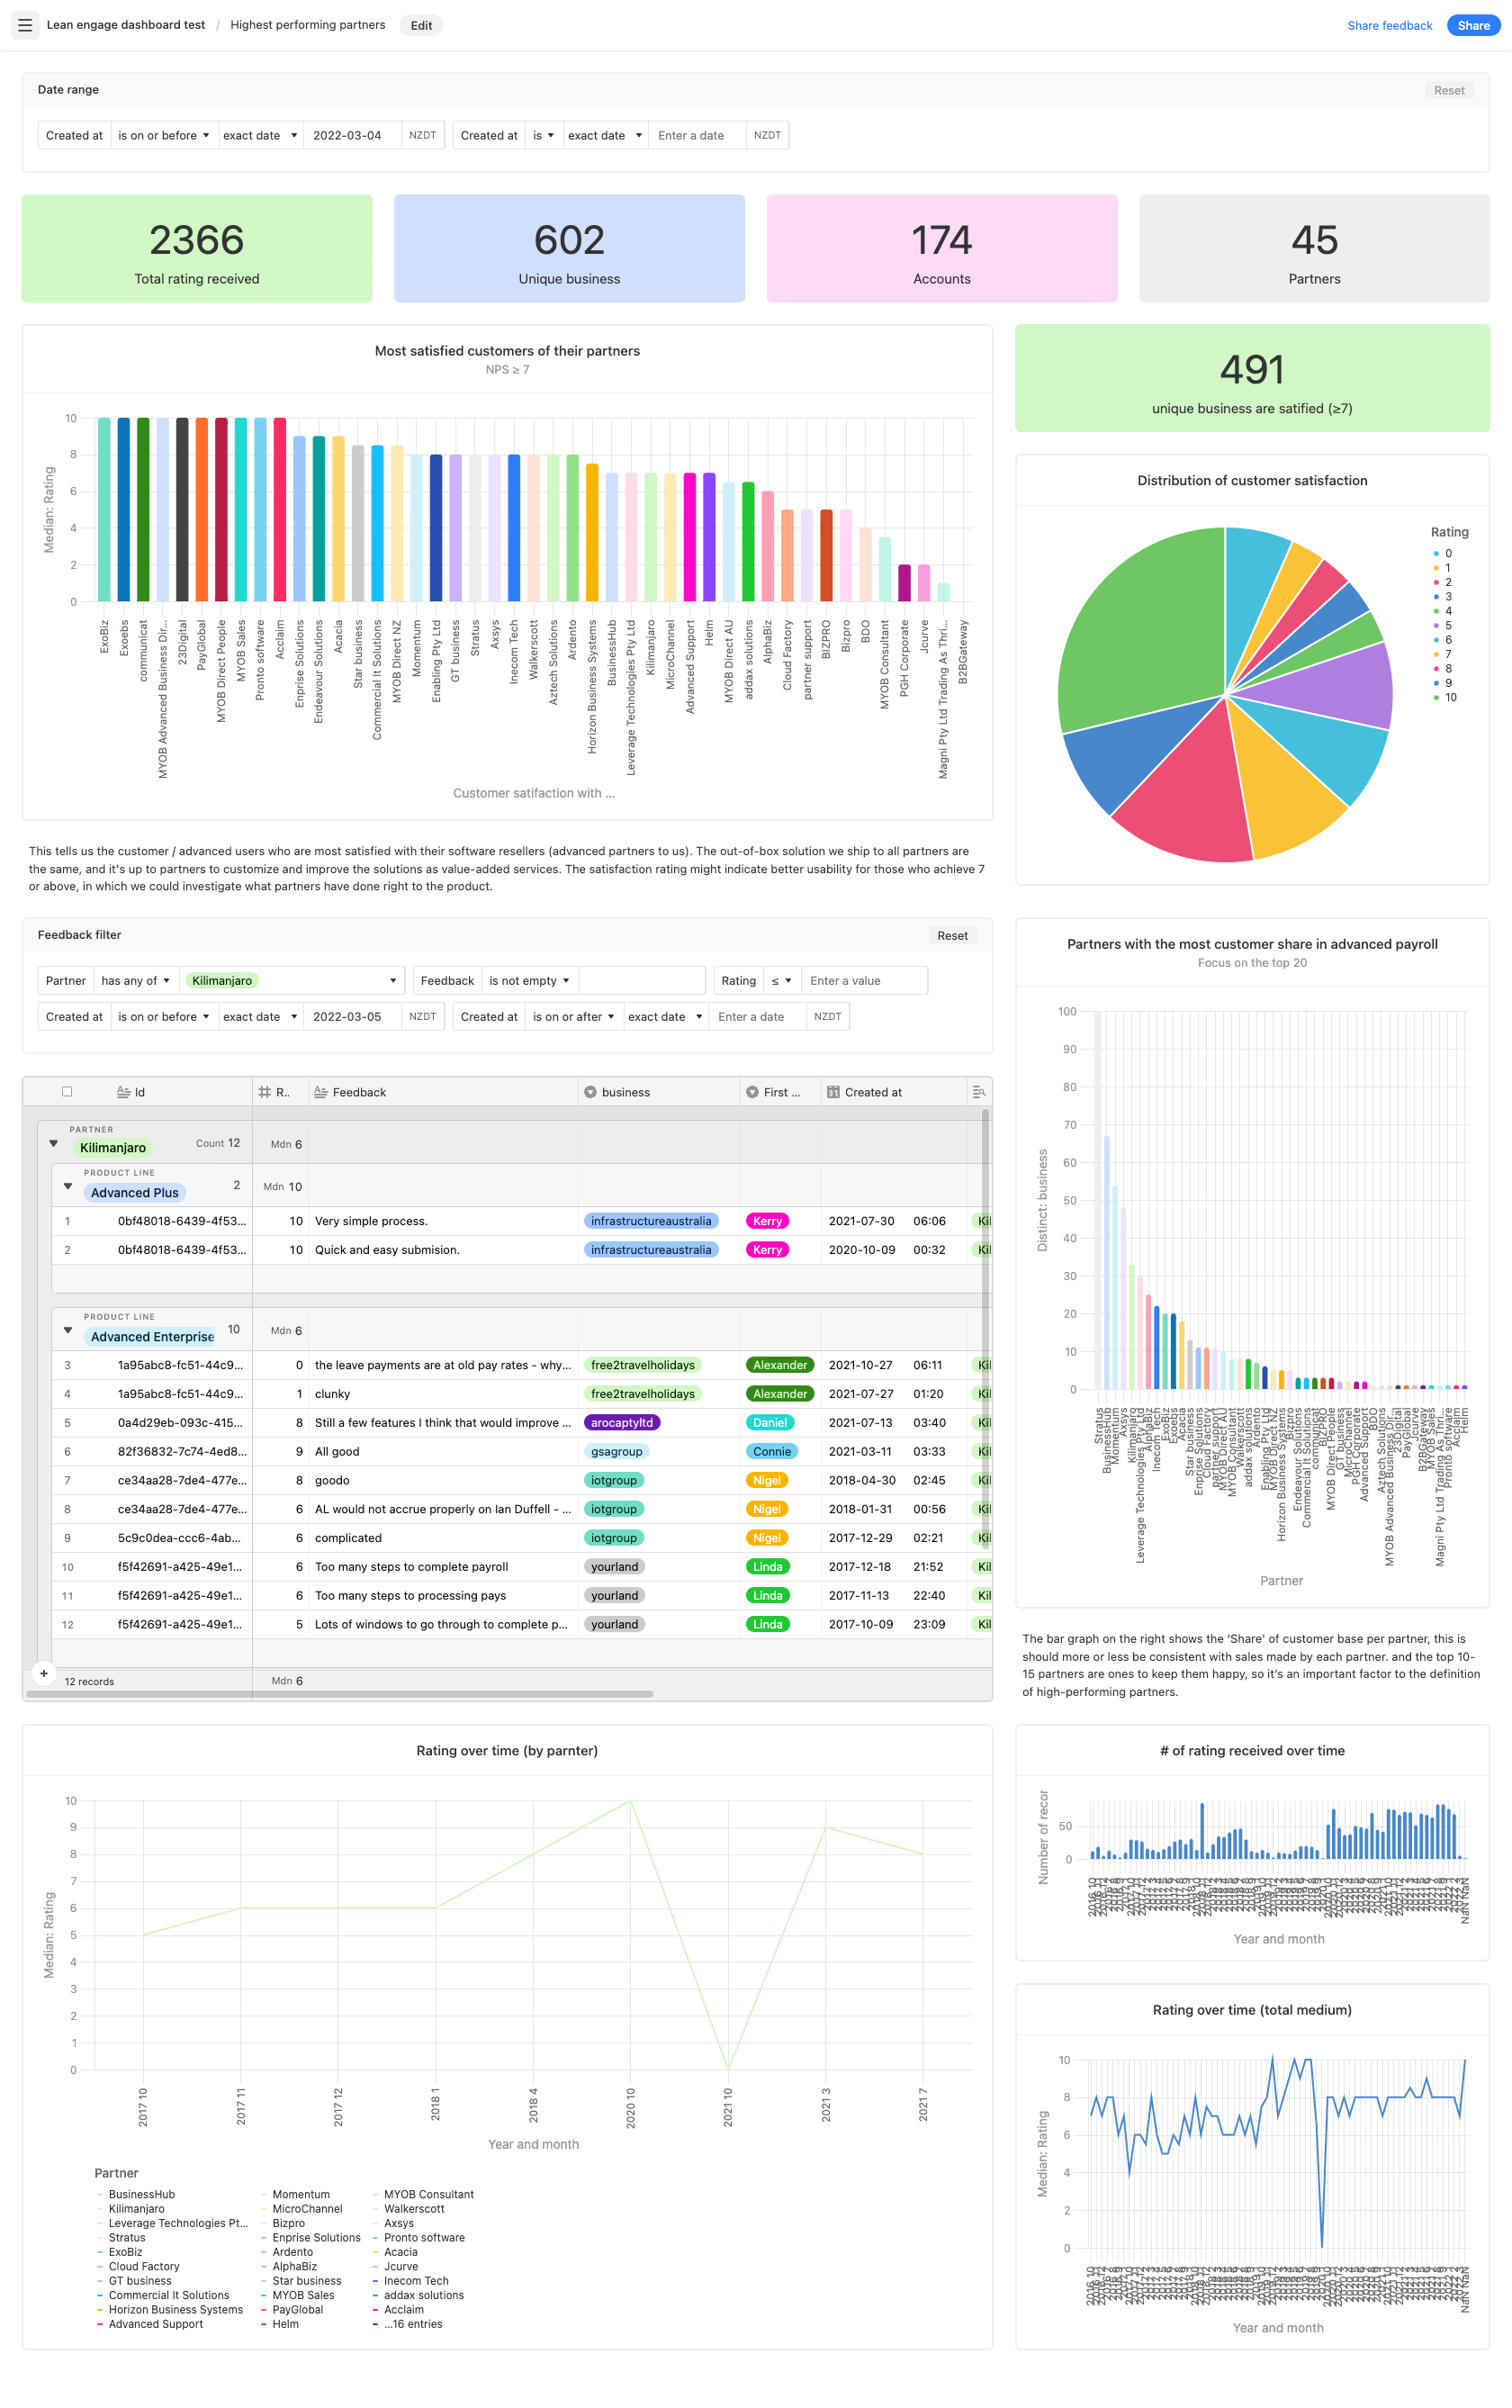
PARTNER DASHBOARD
Among around 30 partners, we are eyeing the ones with the best CSAT and high customer share as indicators of good prospects. Selling direct has changed the relationships we had with partners, subtly shifting the collaboration to competition. To build a better relationship with them, we involve them in product prioritization and give them influence on product decisions to demonstrate their value. Later, we involve them in report reviews. What really helped later on is MYOB's acquisition of 3 partners, which greatly standardized report quality (resolving conflicts of interest) and made our technical review process more reliable.
Gap analysis
There were over 100 reports in the desktop version. My first task was to collaborate closely with their product owners to determine the usage and priority. Many of the desktop reports were print-oriented, which led to redundancy (e.g., creating a new report name for minor differences in a couple of columns). As a result, we decided to discontinue support for many of these reports in the online experience.
Following a gap analysis, we compared the cloud reports to their desktop counterparts based on views and functions. This includes identifying pitfalls in metrics, filters, groupings, sorting, and options.
Additionally, we conducted competitor analysis to ensure we are not confined to our own bubble and to align with industry trends. The gap analysis sets the stage for the next step: creating mock-ups of new reports with some sample data.
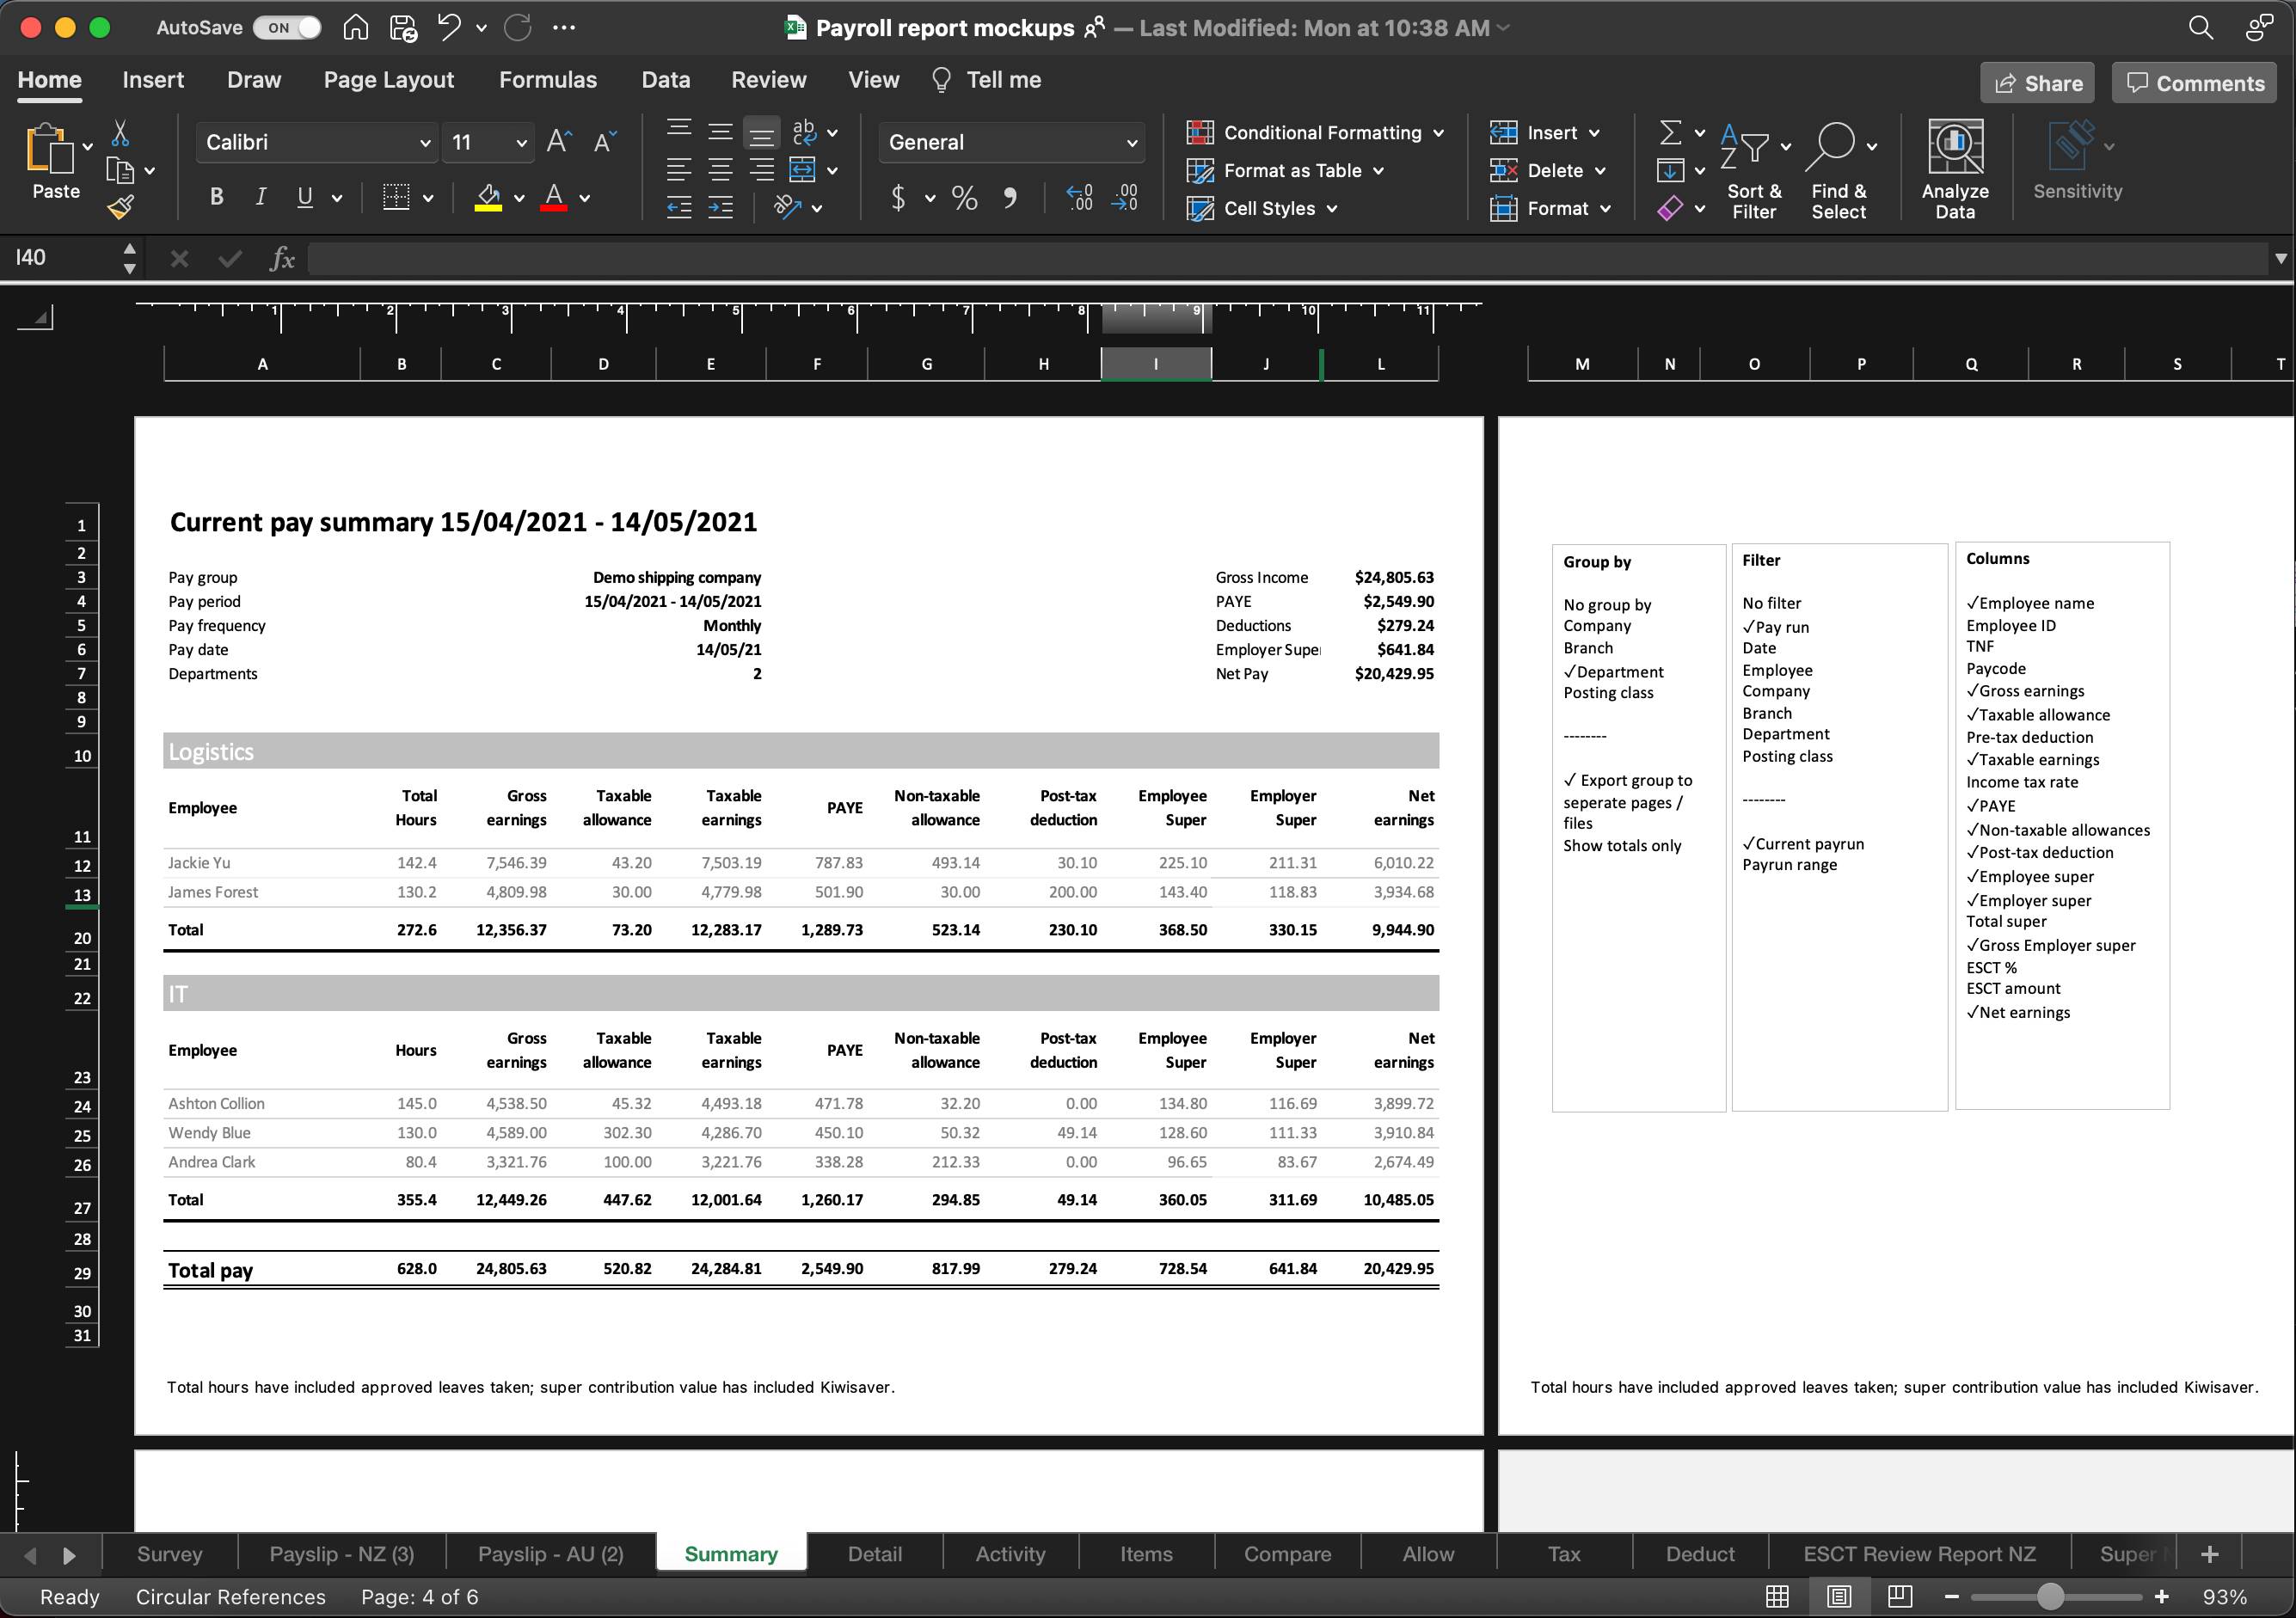
Mockups
We used Excel for mockups, given that it's a formula-driven, number-intensive feature. Excel offers more versatility than other design tools, and we can easily share files online with experts for collaboration. It's handy to create the initial 20 assumption-based report mockups and validate them, as having nothing to show in the user interview can be intimidating. We held workshops with support, consultants, PMs, and frustrated users, carrying out on-the-fly updates to numbers and calculations. We also assessed how the reports looked in digital and print.
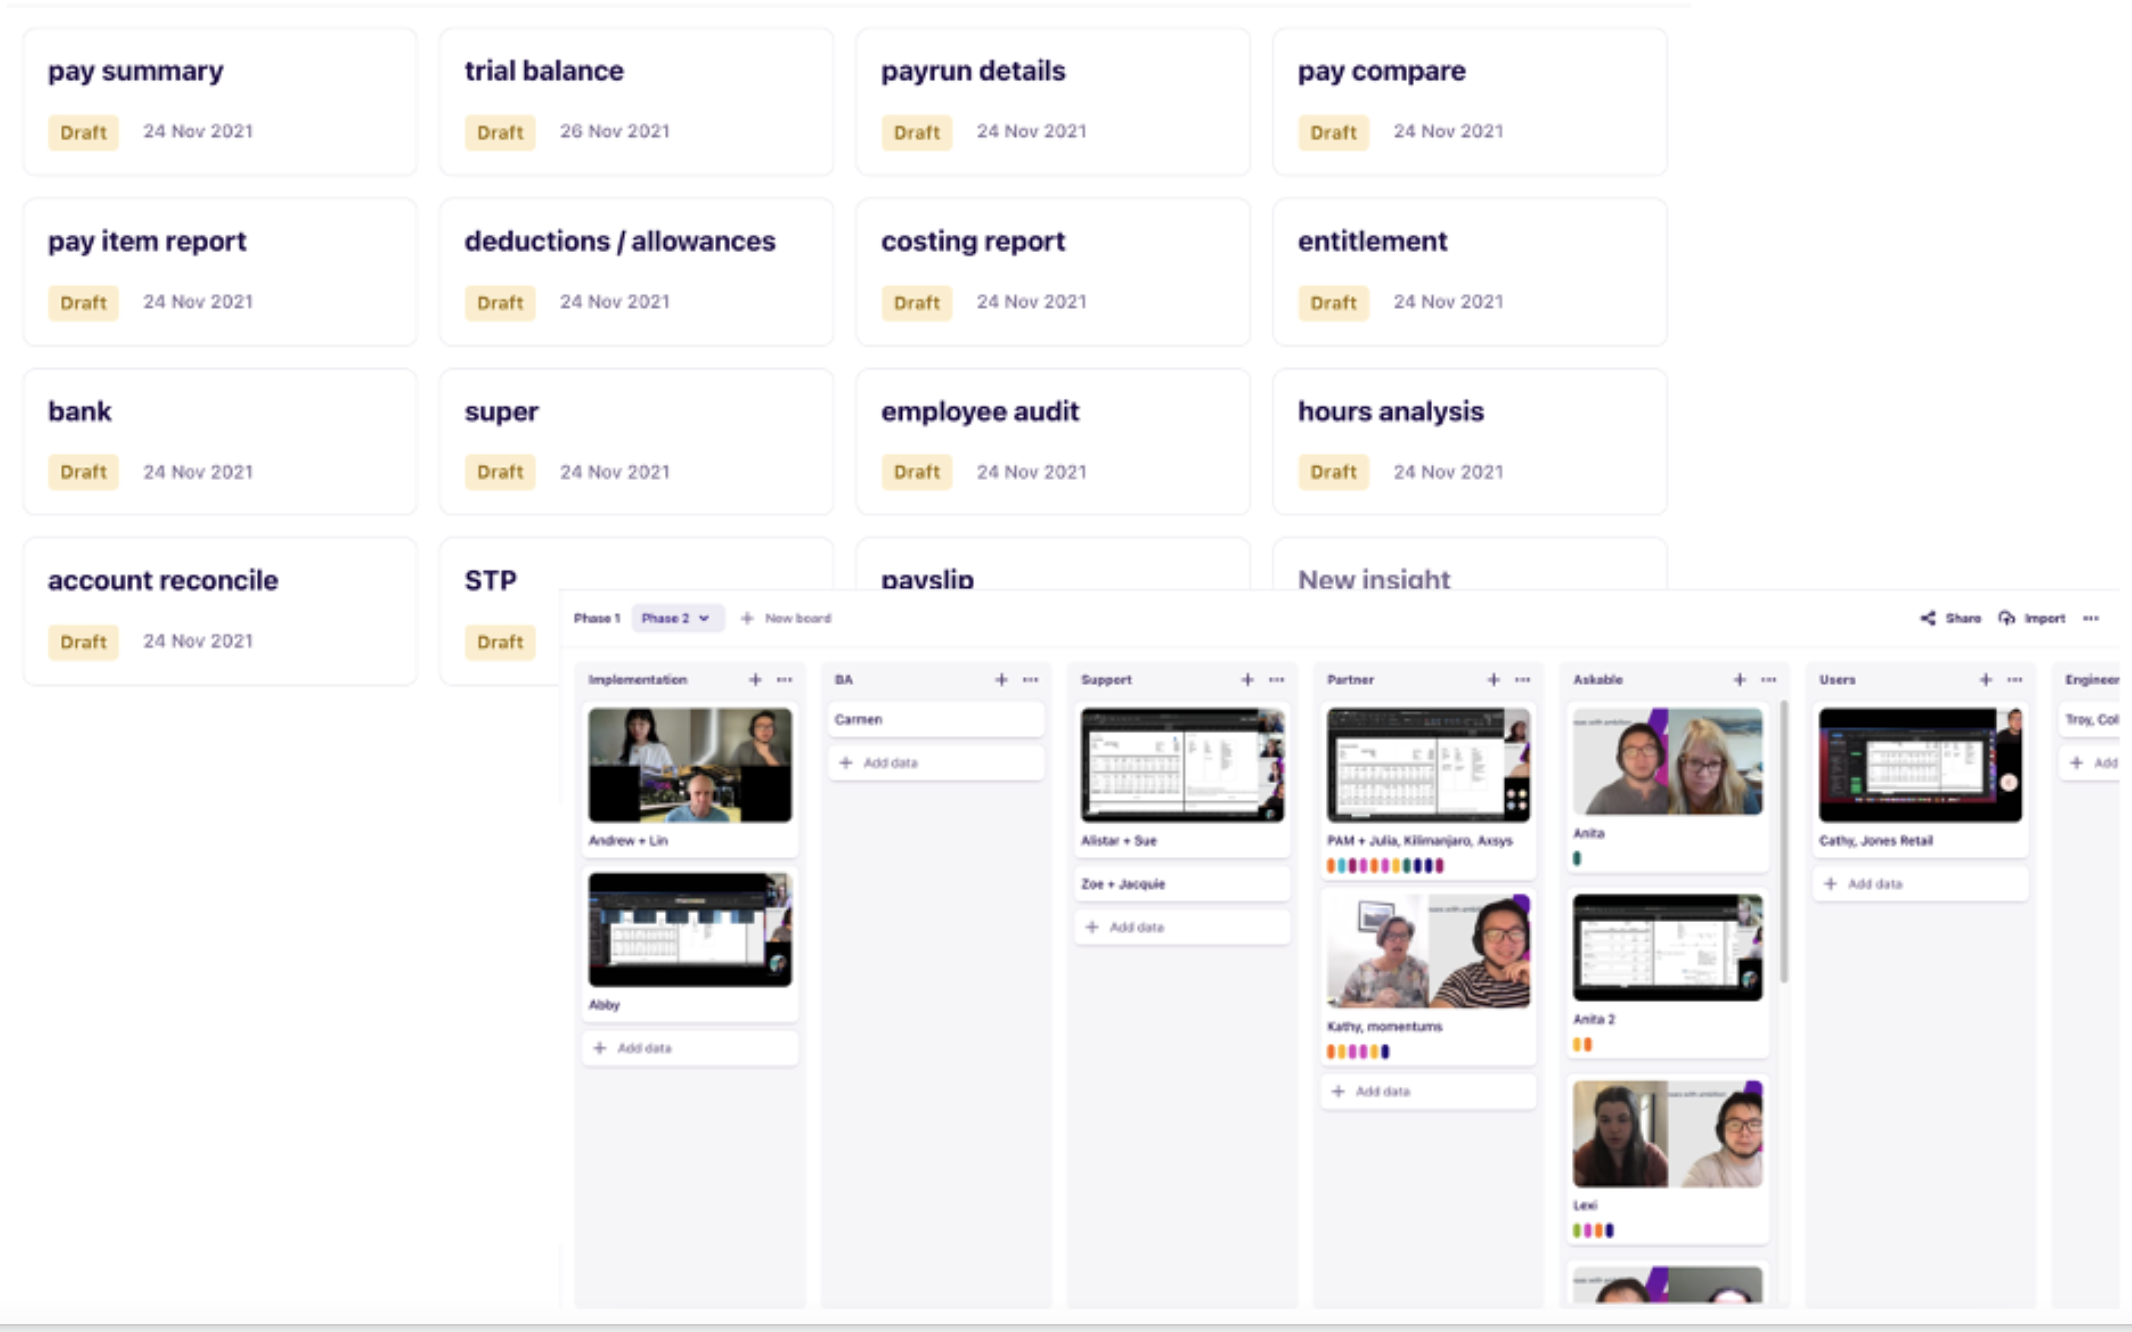
Research
Qualitative
Partners x6 Customer x4 Non-customer x6 Service consultant x3 Support specialist x4
Quanlitative
Report usage analysis Survey
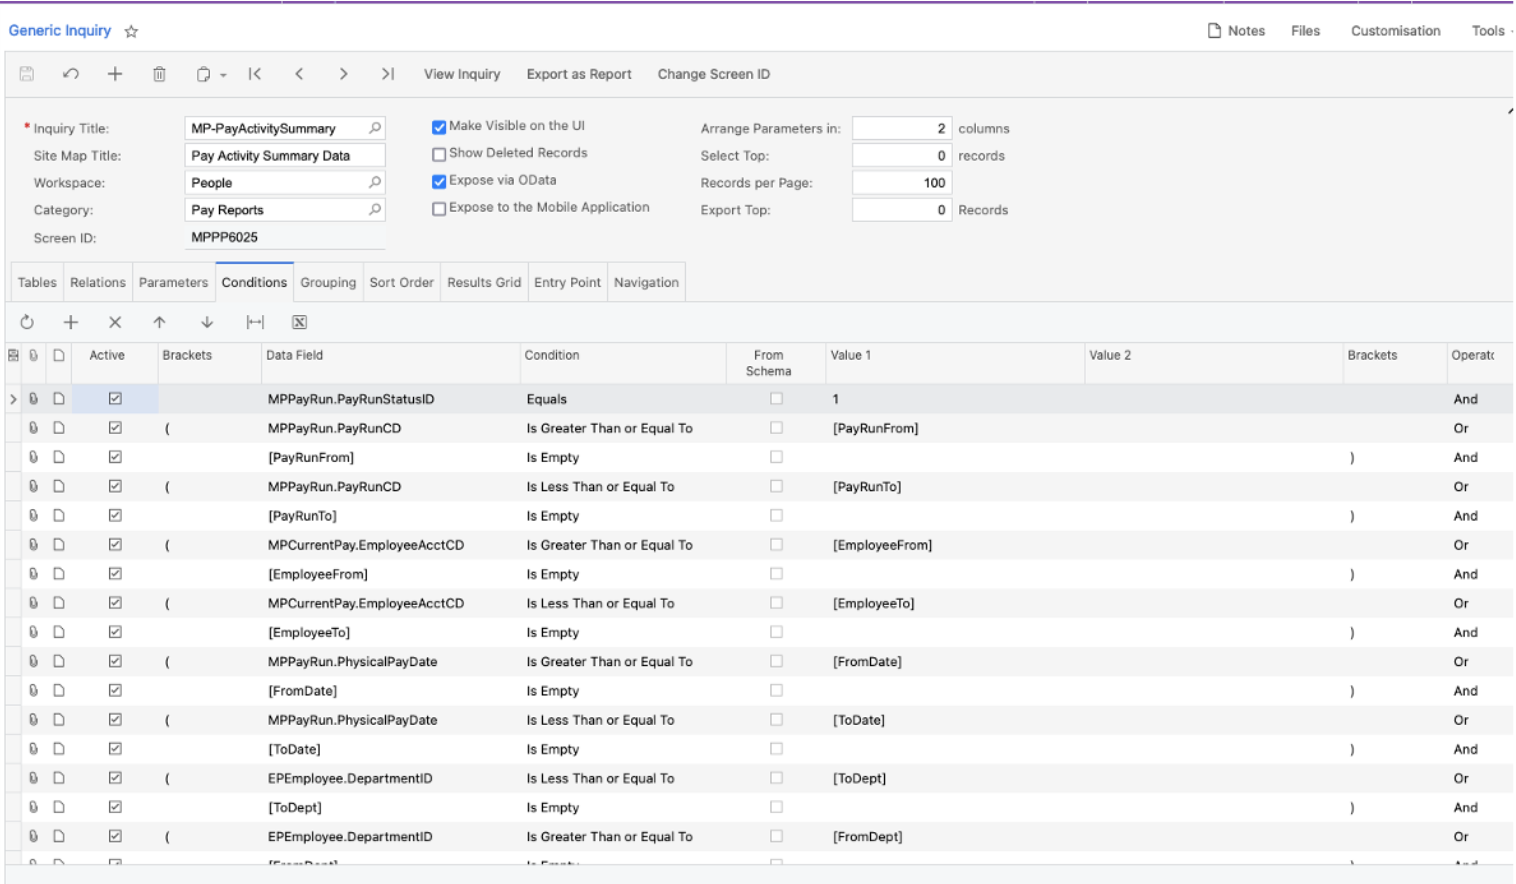
Using Dovetail, we've brought together feedback and share key insights for our top-priority reports. Our research delved into different user personas for our mockup. Everyday payroll users are looking for a ready-to-use solution – some might not even be familiar with Excel. Subject matter experts in the domain shed light on the obstacles they encounter with the current reporting system. Partners, who have a wealth of experience in crafting Generic Inquiries, help with technical review. The collective research shape our confidence in the accuracy and user experience of the reports from different perspective.
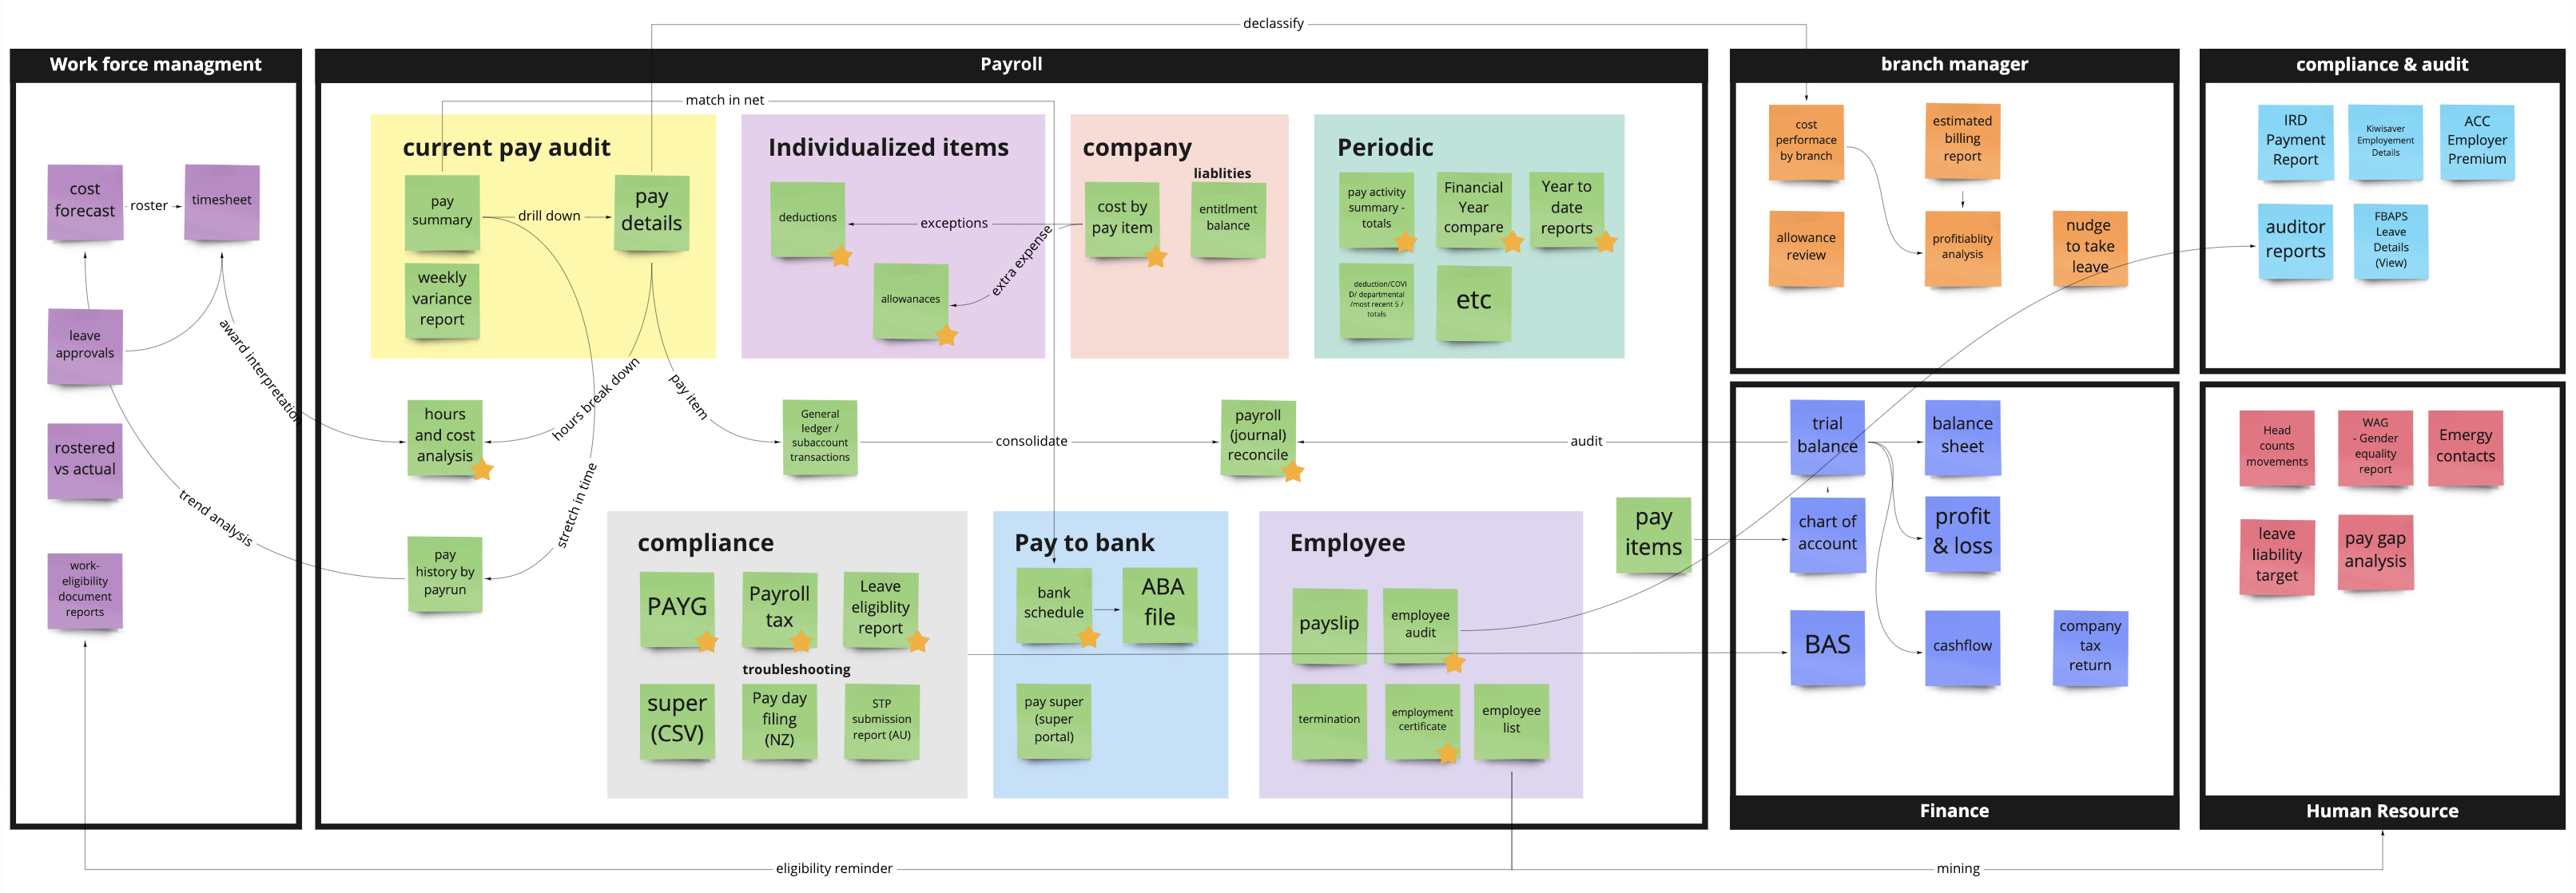
Affinity mapping
Payroll typically sits between HR and finance departments in a business. It's part of data processing, with frontend data from workforce management and backend post-processing in accounting or HR. This framework helps prioritize report delivery, with the core pack taking precedence over the extended family.
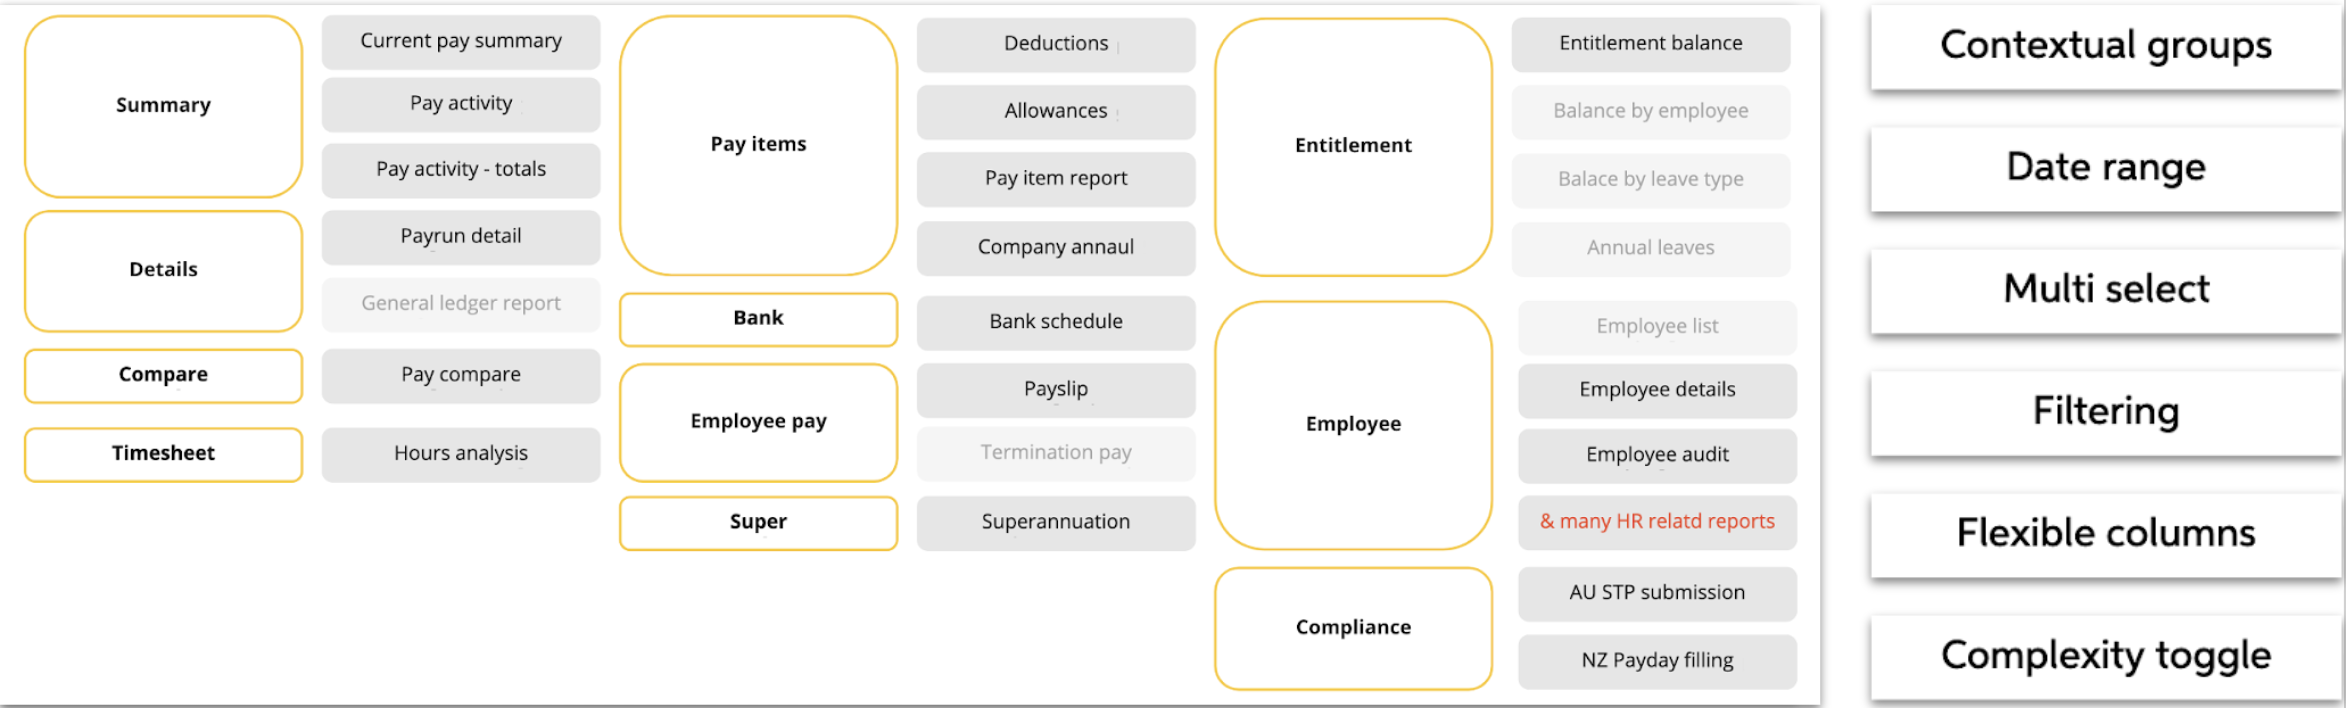
Solution: Report controls
Research has led us to form 11 report blueprints that can be saved into various report templates using an easy view control. This lowers the learning barrier and enables self-service.
Report controls UX for each blueprint include filters, groups, and columns. Some reports are simply views based on the same dataset but with different applied filters. For example, the pay history is a pay summary extended along the time axis, and both the deduction and allowance reports are subsets of the pay item reports.
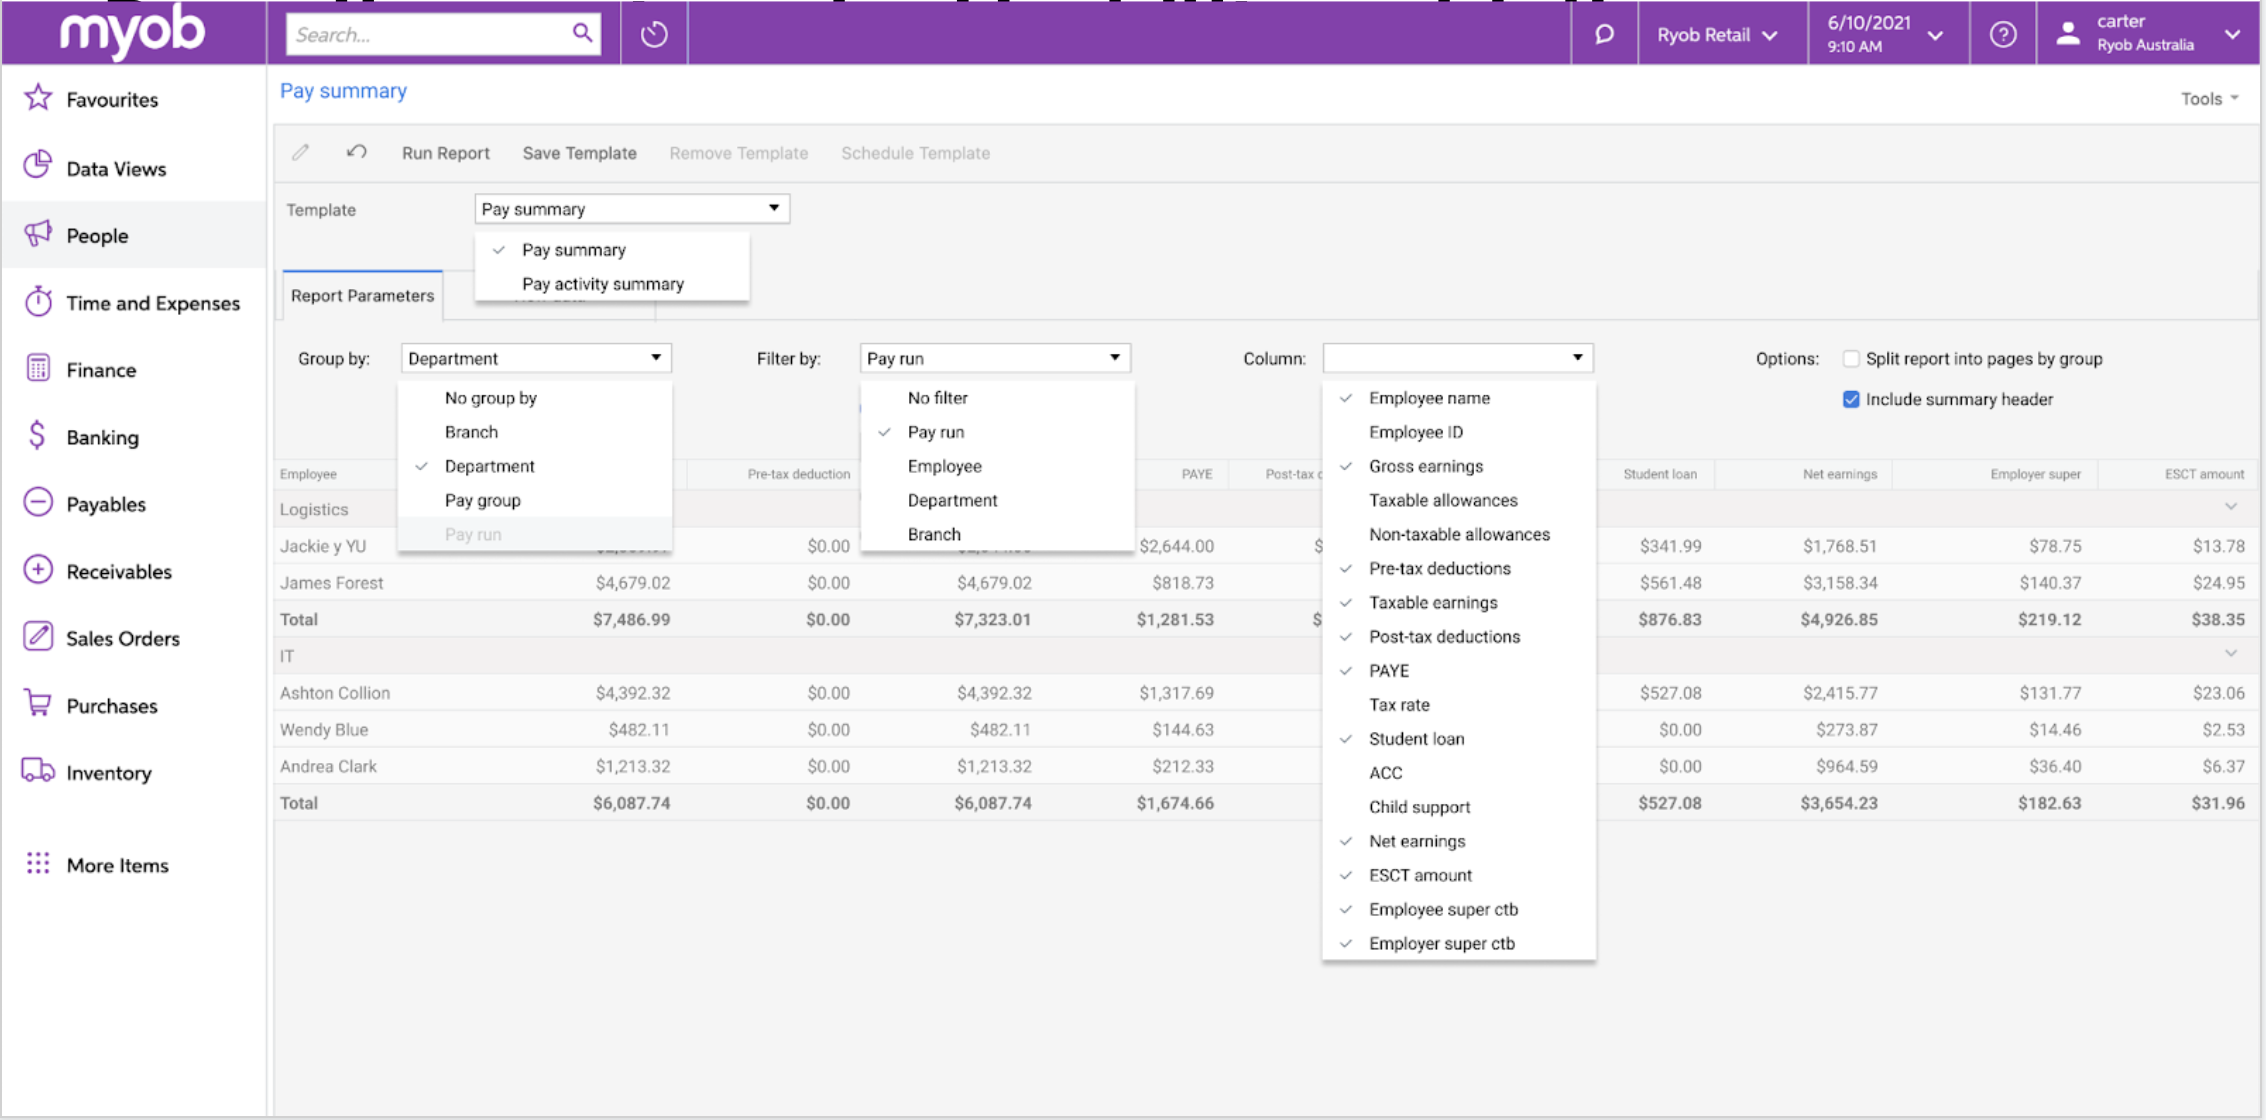
Design
It's actually a pretty straightforward UI and budget-friendly (as I was told by tech lead) execution of the customization concept, essentially incorporating a new dropdown above the table and updating the view based on selections. Users can save these views or templates and manage them on the fly. The simplicity lines up with the user skillset, requiring no learning curve.