Unlock geospatial capability for kiwifruit growers

Deloitte partnered with Zespri to co-design a new portal that would modernise how kiwifruit growers manage operations and compliance. Over a 10-week engagement, we led a series of in-person Design Sprints with Zespri subject matter experts and growers, rapidly iterating to deliver build-ready designs for seamless handover to their development partner.

This case study highlights how we unlocked geospatial capability and applied an agile, user-centered Design Sprint methodology to drive digital transformation.

TL;DR

Deloitte was brought in to define the MVP experience and produce build-ready designs over a 10-week period. We partnered with Zespri to transform whiteboard concepts into pixel-perfect designs, reimagining how kiwifruit growers manage on-orchard compliance. By unlocking new geospatial capabilities, we reduced the time required to complete spray diary compliance by 70% every year, giving growers more time back to focus on fruit production and creating more meaningful experiences in the field.

As UX Lead, I oversaw and delivered a completely new grower portal experience: extending the Zespri brand, turn research into product strategy, and developing a product blueprint grounded in grower insights based on 30+ sessions with growers, orchard managers and contractors. I facilitated 5 Design Sprints with 10 full-day in-person workshops, co-creating solutions with cross-functional stakeholders, putting user experience at the heart of meeting functional and compliance requirements, and get programme leader to align on narrative and objectives of digital transformation.

Our lean design team of 3 operated at an accelerated pace, collaborating closely with the development team to negotiate the best solutions across experience, systems, and services. We delivered: 450+ build-ready screens, 200+ user stories, and an end-to-end responsive design system featuring integrated geospatial mapping, enabling growers to confidently manage operations across devices.

OBJECTIVES

Redesign of a complex paper-based system and empowered farmers to effortlessly manage orchard records on the go

Imagine a single solution that consolidates multiple tools and paper-based forms into one intuitive platform. A visual, map-based digital experience was essential to mirror the grower’s mental model of their orchard, empowering rather than hindering their ability to get work done. Our solution addressed key challenges in the previous system, where users struggled to visualize orchard layouts, annotate hazards, and track spatial data such as pest levels and spray coverage. We introduced several core capabilities:

1. Interactive map views allow growers to intuitively understand their orchard in physical space and communicate with others. They can seamlessly switch between table and map views to stay on top of tasks.
2. Spray records support forward planning by enabling users to save drafts as templates. These records flow directly into risk management and pest monitoring labels on map, removed disconnected workflows and reducing double handling of data.
3. Risk areas, spray zones, and map features can be drawn and saved directly on a digital map. These annotations are reusable year after year, saving growers significant time.
4. Mobile and tablet accessibility is essential, as most growers work in the field. The experience is optimised for use across devices, ensuring flexibility and confidence on the go.

UX for geospatial capablities

 Delivery for Zespri covers everything in the future-state app, going beyond just geospatial feature. This case study centers around the user experience challenges within the Geospatial domain, as it's a core value proposition and map is a connective element across different features, including orchard activities, spray planning, access & relationship management, compliance tracking, and more. 

CHALLENGE 1

2

3

Growers made critical decisions without clarity on maps, leaving them operating in the dark.

There's no way to visually assess whether an orchard has successfully passed its audit, exceeded residue levels, or is facing an severe pest outbreak. There are no quick ways to visualise chemical spills, spray drift zones, or public health concerns that required attention. The current system is reactive, designed only to take data in without alerting or preventing issues, relying solely on the grower’s experience and paper-based guides.

Why it mattered?
Spray application is one of the most tightly regulated and high-risk activities in kiwifruit production. In the absence of an smarter mapping solution, growers often had to make decisions based on memory or outdated printouts (as spraying could be done by someone else), putting compliance, crops, and export eligibility at risk.

Solution

To aid growers in spraying chemicals, applying fertiliser, the new solution transforms existing data and numbers into color-coded maps with labels and defined areas. Growers can toggle map layers to isolate and visualise pests, risk zones, hazards, and spray history. The system flags risks and guides users to take appropriate actions before they become compliance issues. All of this is accessible on any device, supporting farmers directly in the field, not just behind a desktop.


Impact:
Centralising map data and sharing it in real-time with everyone who accesses the orchard empowers growers to make confident, on-orchard decisions in rapidly changing field conditions. This change is made seamlessly across all devices, mobile has evolved from being an enhancement to a Must Have.

1

CHALLENGE 2

3

Manual map reporting has become an outdated solution that has led to rework, costing growers and reviewers hundreds of hours.

Annual compliance reports require orchard businesses to submit detailed descriptions and map labeling. Growers often resorted to manually marking hazards, chemical storage locations, and neighboring features on paper maps, which were then scanned and sent to Zespri. Lacking the capability to generate digital map data, these static illustrations were inconsistent, error-prone, and incompatible with other compliance systems, resulting in yearly stress for both growers and Zespri’s compliance team.

Why it mattered?
As a government-approved entity, Zespri serves as NZ’s proxy for kiwifruit export reputation and relies on accurate geospatial records to verify orchard eligibility and compliance. The absence of digital mapping led to significant back-and-forth between orchard businesses and Zespri reviewers, turning annual audits into a time-intensive and frustrating process.

Solution

Growers can draw site features directly onto the orchard map allowing them to visually label hazards, sensitive zones, and nearby schools. These inputs now flow seamlessly into the broader compliance system, becoming part of the annual Site Risk Assessment. This enhances safety planning (e.g., avoiding spray drift near sensitive community zones). This is something growers already do and record as part of daily orchard operations, and it automatically checks the box for compliance.


Impact:
Unlike paper maps, which are used once and then locked away, digital map data is a living, auditable dataset that carries over year to year, with around 90% remaining consistent. This breakthrough reduces the effort required for agri-chemical compliance and gives Zespri auditors greater confidence in data accuracy and integrity.

Building the solution:
We partnered closely with Azure Maps experts to guide the implementation, leveraging out-of-the-box capabilities while designing an experience tailored specifically to growers.

1

2

CHALLENGE 3

It's more than just signaling and labeling; map is a connective element to all capabilities.

The current system relies on a text-based format featuring tables and blocks, which lacks visual context. However, it remains the baseline for orchard managers, growers, and contractors. From our research, we’ve learned that improving the digital map adoption is crucial.

Why it mattered?
The lack of spatial understanding slowed job execution, leading to unmet expectations and the ineffective use of geospatial capabilities. This oversight can be costly, potentially rendering entire orchards unharvestable due to issues like double-spraying or missed treatments.

Solution

To enhance the map-centric experience, we aim to integrate geospatial functionality into various workflows, making digital maps more accessible and intuitive for everyday operations. For example, users will have the ability to create spray records by directly selecting blocks from a geospatial map or opting for a conventional list view. Switching between these views with just a single click.

Consider varying levels of digital literacy, we developed the onboarding experience for using the map feature, tailoring tooltips for each jobs to the done in different contexts. enriching their initial experience, from drawing shapes to selecting blocks for spraying.

User feedback:
The initial prototype testing indicated that the map was intuitive to use. Additionally, we discovered that users likes to initiate the spray record from a table list, while using the map as an supplementary tool in the record creation process, and this becomes a strong entry point for a introduction to the geospatial feature.

~breathe~

Design sprints

10-WEEK DESIGN SPRINT

Navigate a complex team structure under tight deadlines to deliver impactful large-scale designs through effective collaboration

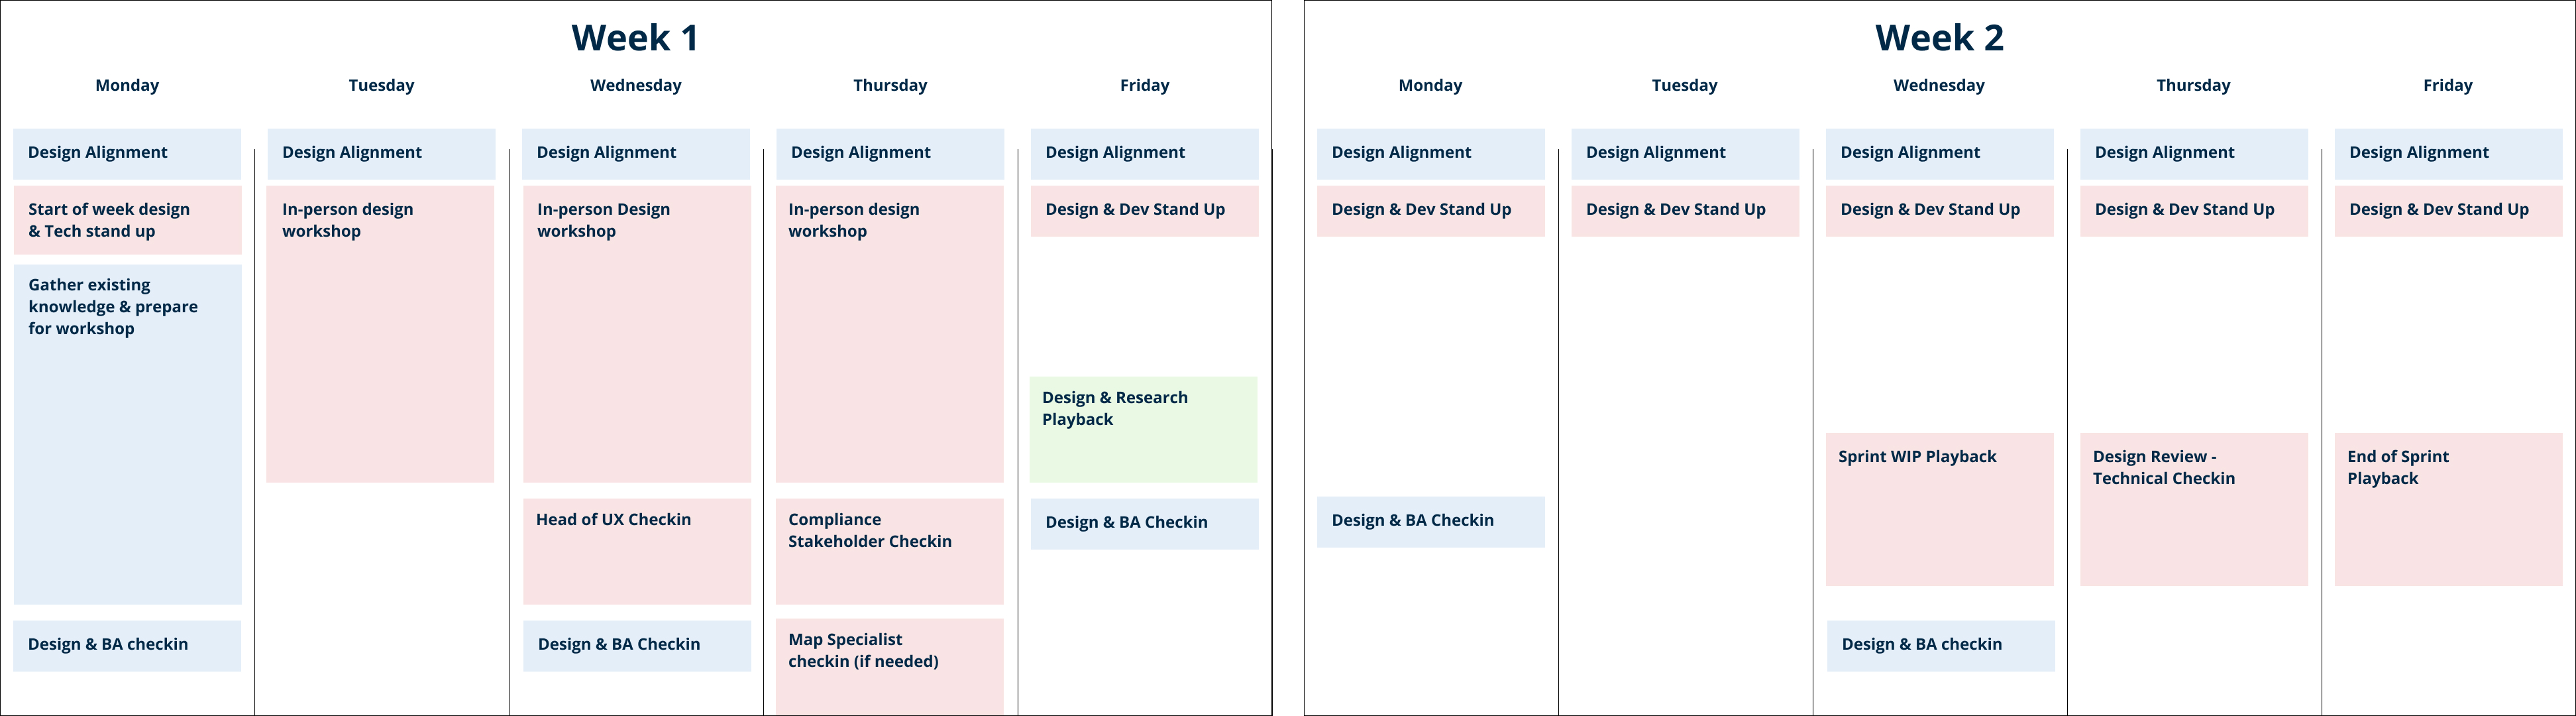
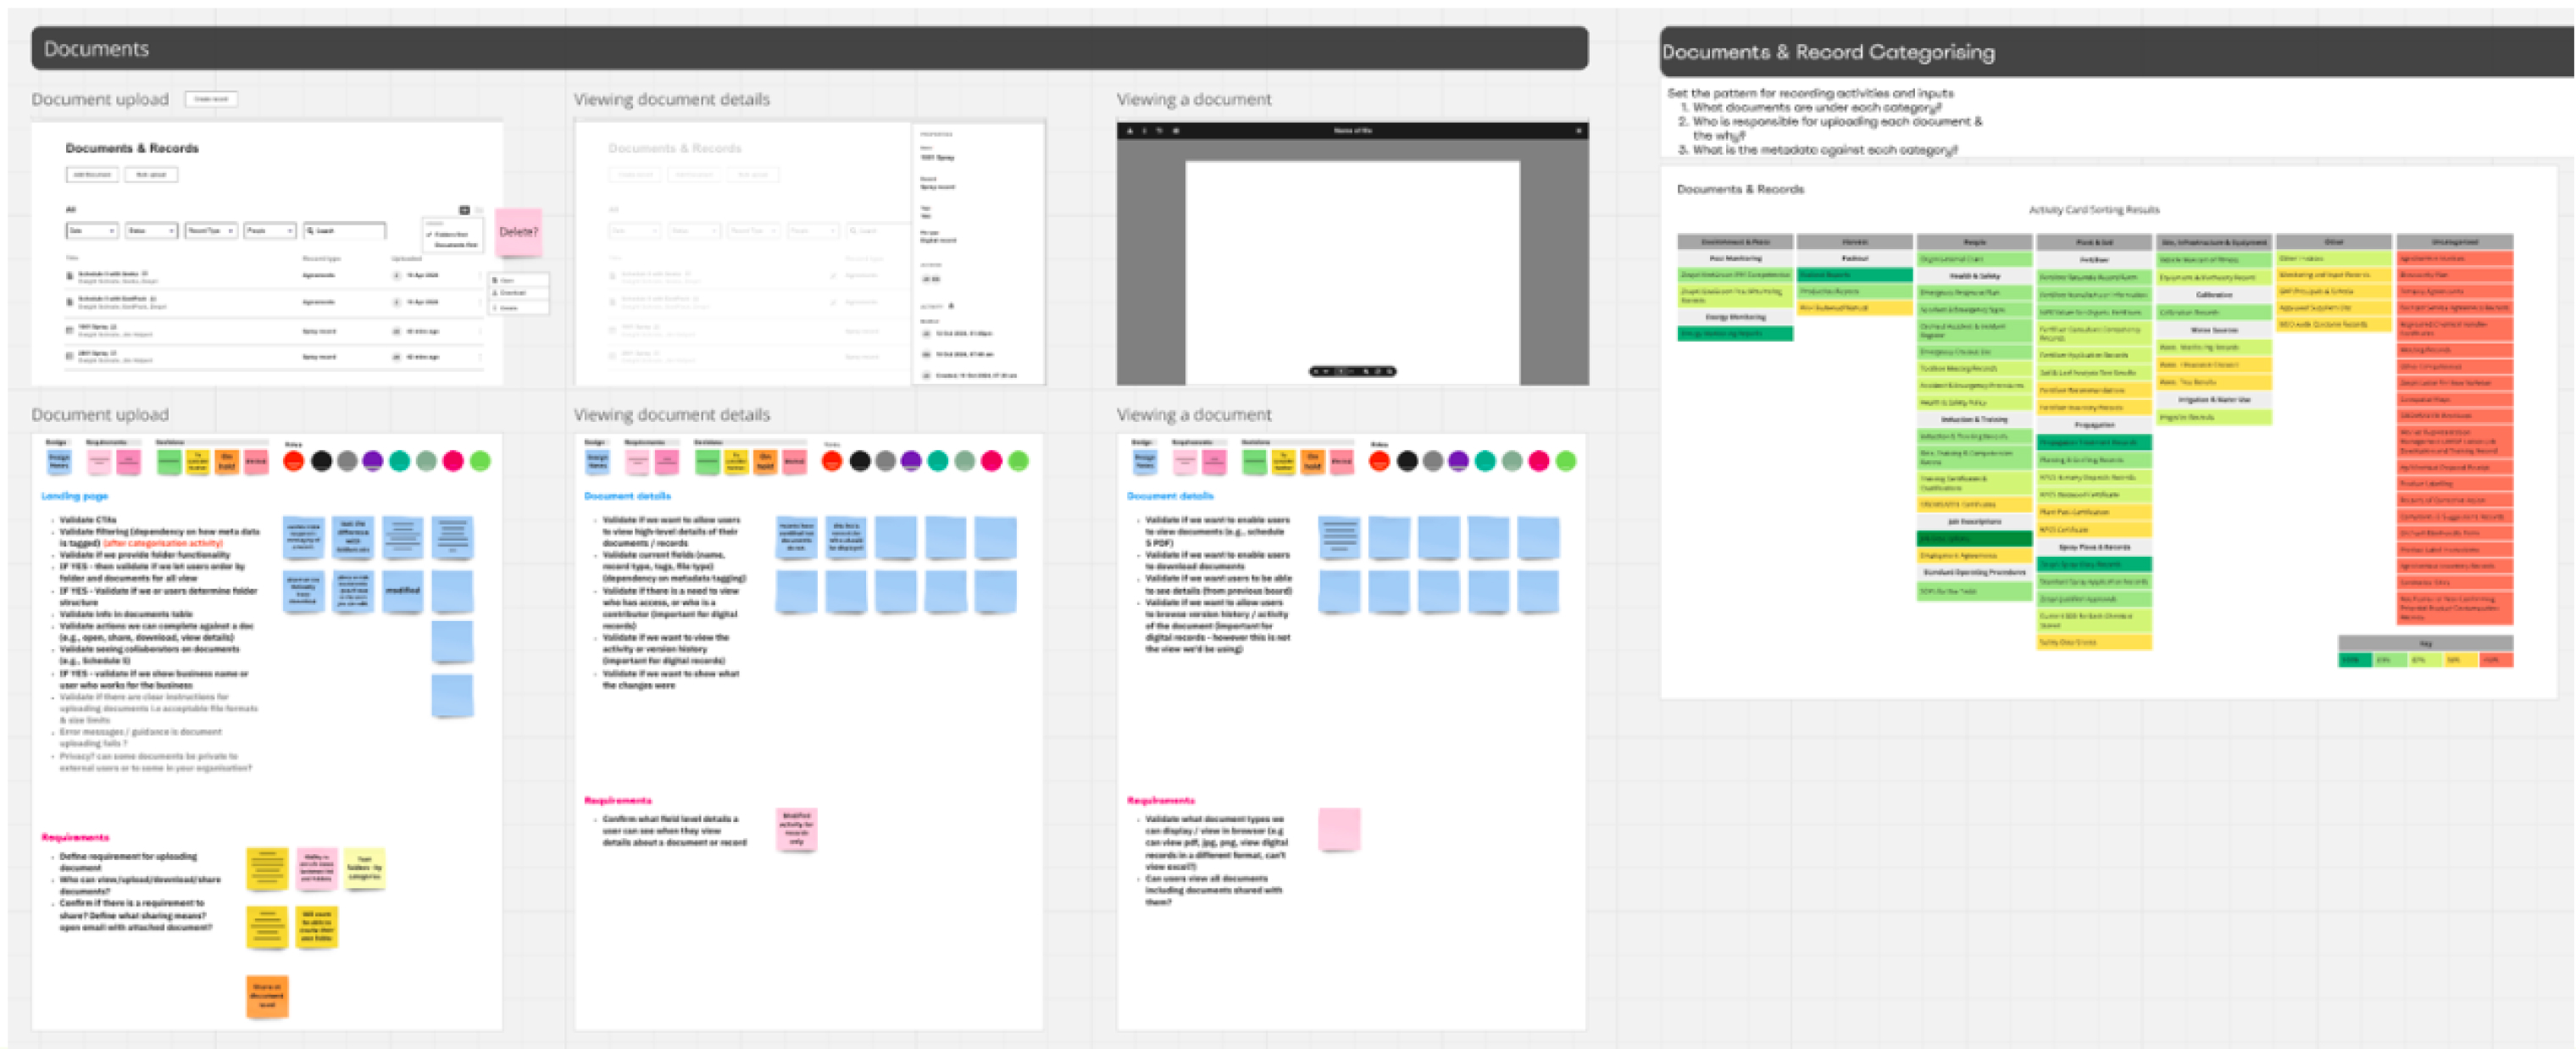
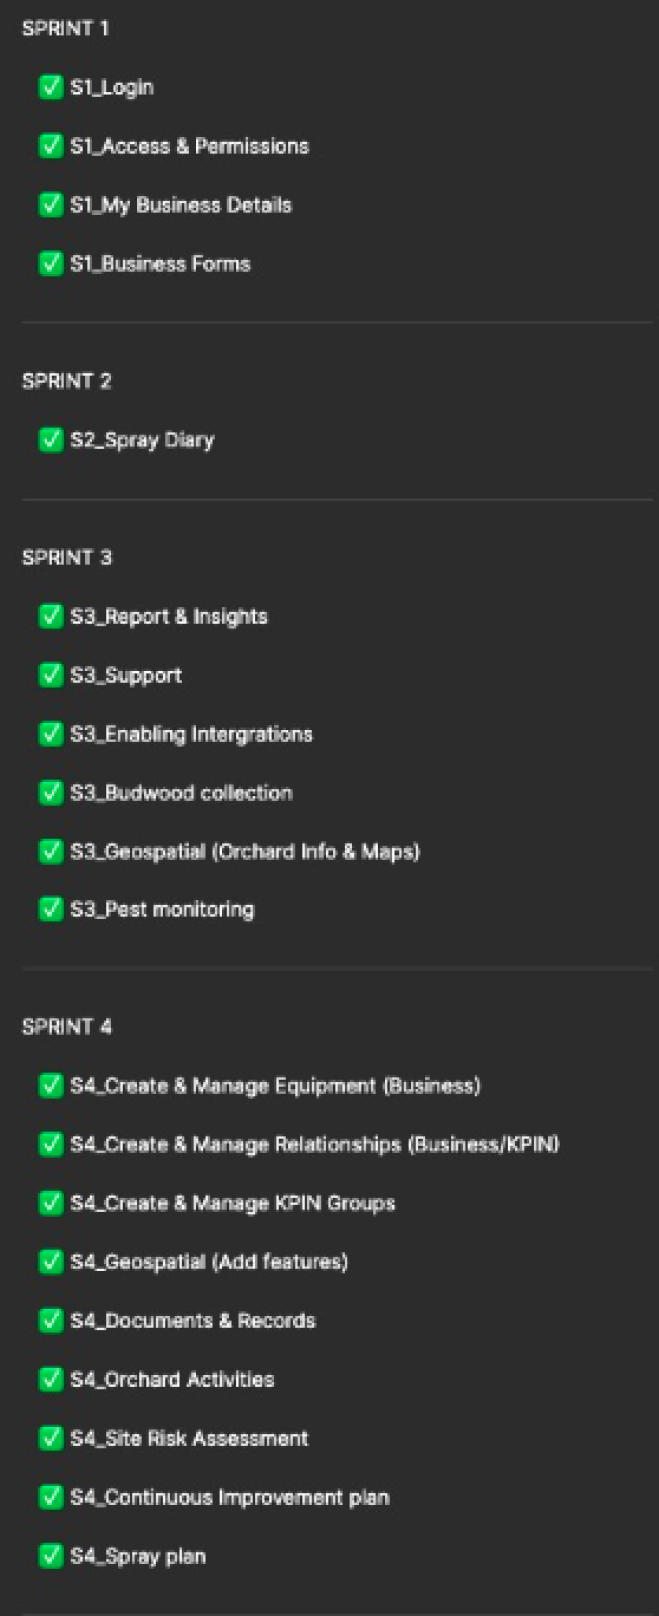
Over the course of 5 sprints, we organised features into cohesive groups and target each group per sprint, transitioning from box drawing to comprehensive design. We started each sprint by preparing a collaborative Miro board with guiding questions and current state analyses. We then conducted three full days of in-person co-design workshops with Zespri subject matter experts and growers. These workshops were co-facilitated with business analysts, allowing us to explore edge cases, real-world scenarios, and regulatory requirements thoroughly alongside growers and stakeholders.

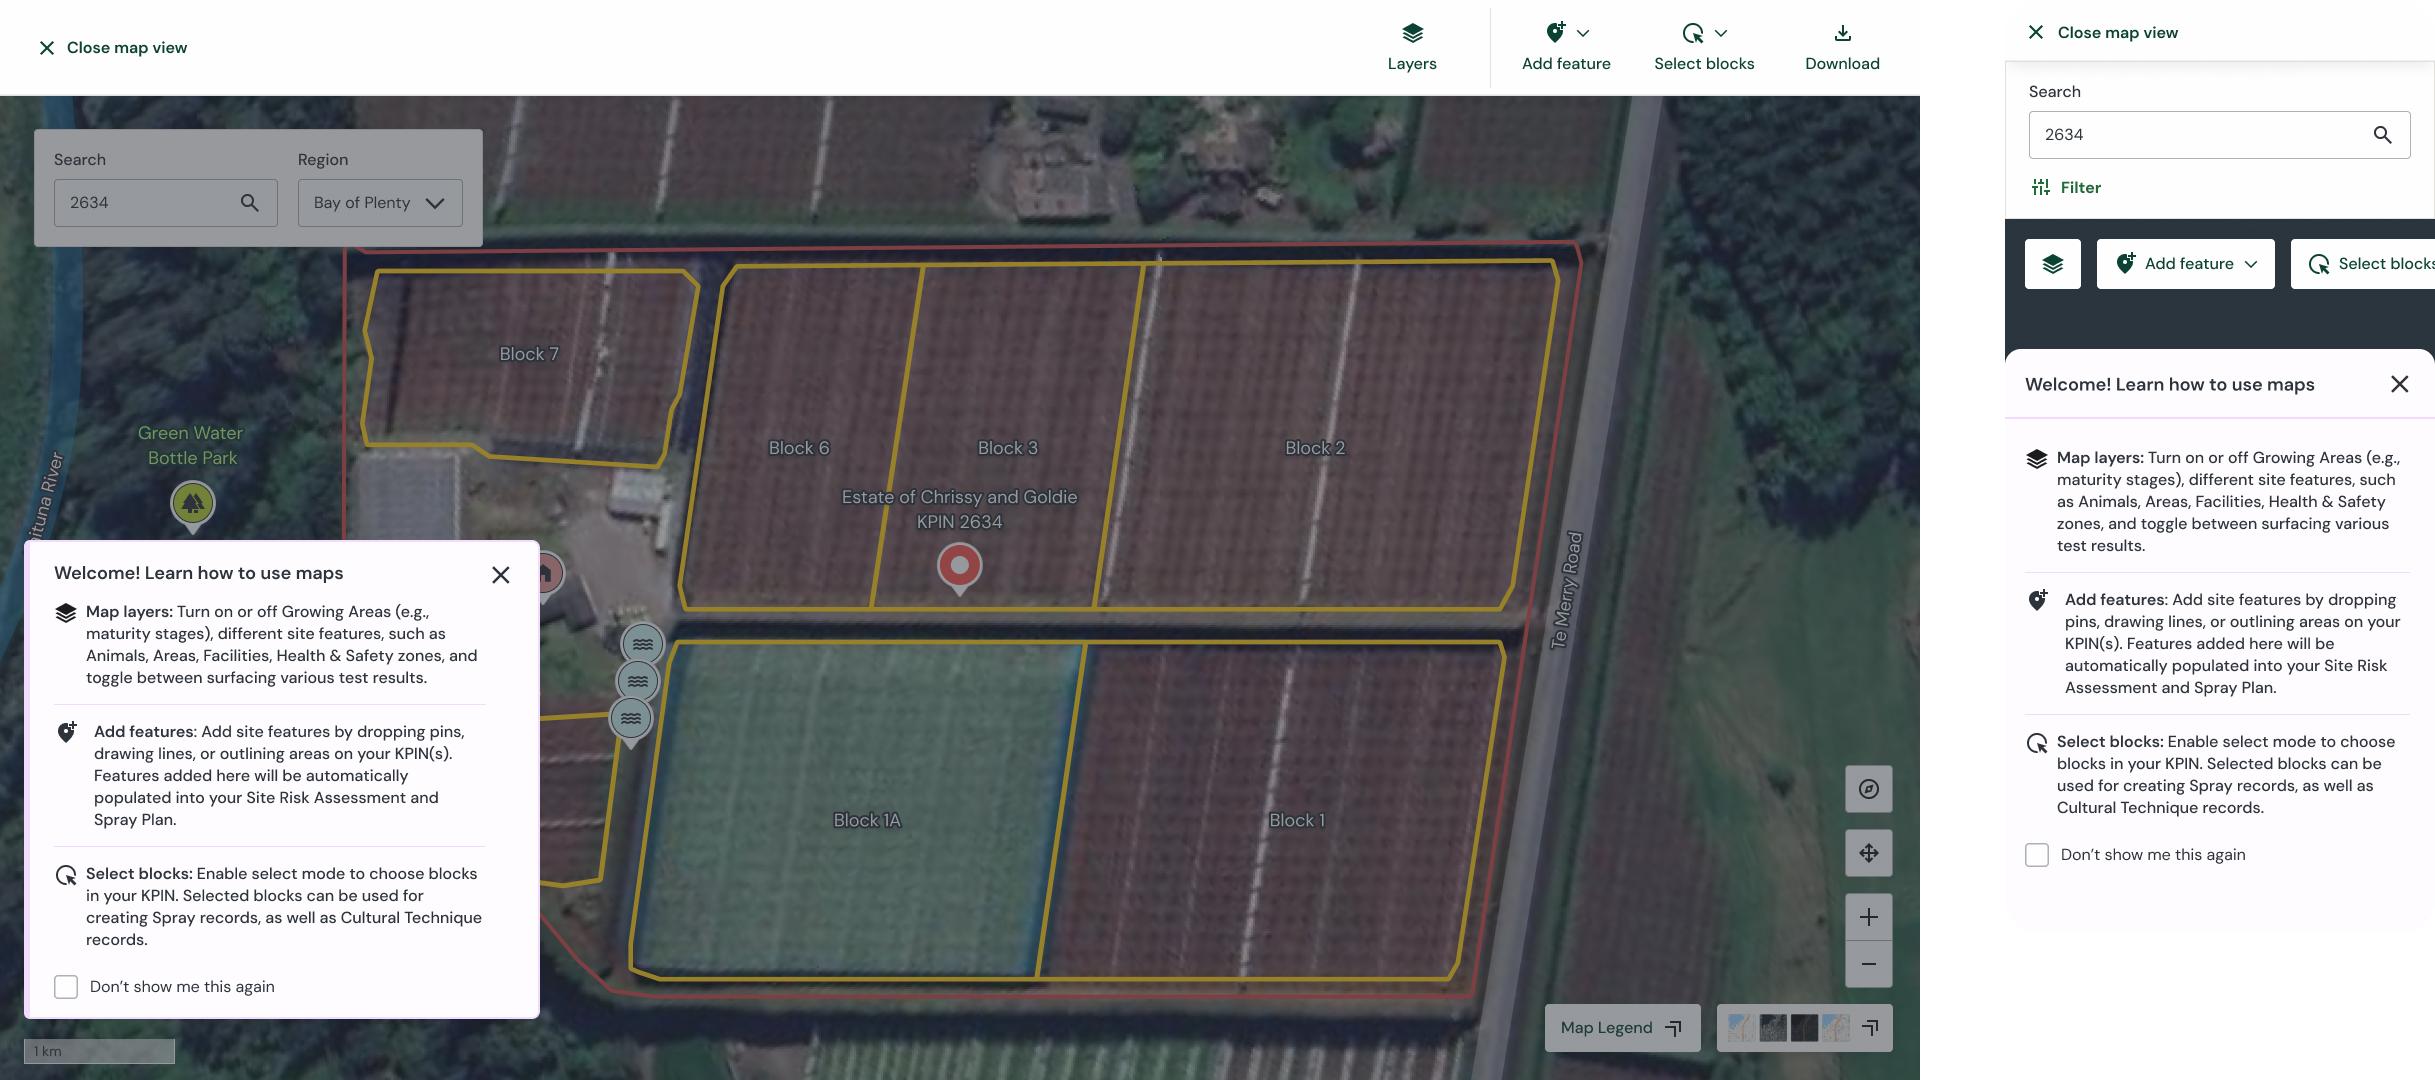
Following the conclusion of week 1 of the sprint, we transformed rough concepts into polished, high-fidelity, responsive screens. To ensure clarity and alignment, we conducted regular playback sessions to validate designs. Our daily development check-ins with the third-party vendor, along with mid-sprint playback sessions, design reviews with Azure map experts, compliance team assessments, consultations with the head of UX, and concurrent research workstream. Design didn't just execute, we glued the team and create a dynamic UXD-centric collaboration. This proactive internal and client-side engagement is crucial for securing endorsement at the conclusion of each sprint.

When it comes to design hygiene and practices, we prioritize making our design files easily accessible and comprehensible for both team members and reviewers, following these essential best practices:

- Every workflow has direct links to the relevant Jira stories.
- Each screen should be annotated, including the feature number, flow number, screen number, and any variations.
- Cover edge cases, micro interaction, and error states to assist the non-Deloitte development team.
- Proactively clean up the design library to ensure templates are reusable, and promptly create new components and UX guidelines to share with other designers.

“The value your team provided in 10 weeks exceeded what we’ve seen over 6-month engagements.” — Zespri Product Owner